Catering Technology
Published February 20, 2026
Turn catering orders into profit and efficiency by tracking key metrics, centralizing POS and delivery data, and using dashboards to act fast.

Catering order analytics helps businesses turn transactional data into actionable insights that boost revenue, reduce costs, and improve customer satisfaction. By analyzing event-specific metrics like quote-to-close rates, revenue by event type, and customer lifetime value (CLTV), you can make data-driven decisions that enhance profitability.
Key takeaways:
Catering analytics isn't just about collecting data - it's about using it to make smarter choices that drive growth and efficiency.
Essential Catering Analytics Metrics and Benchmarks
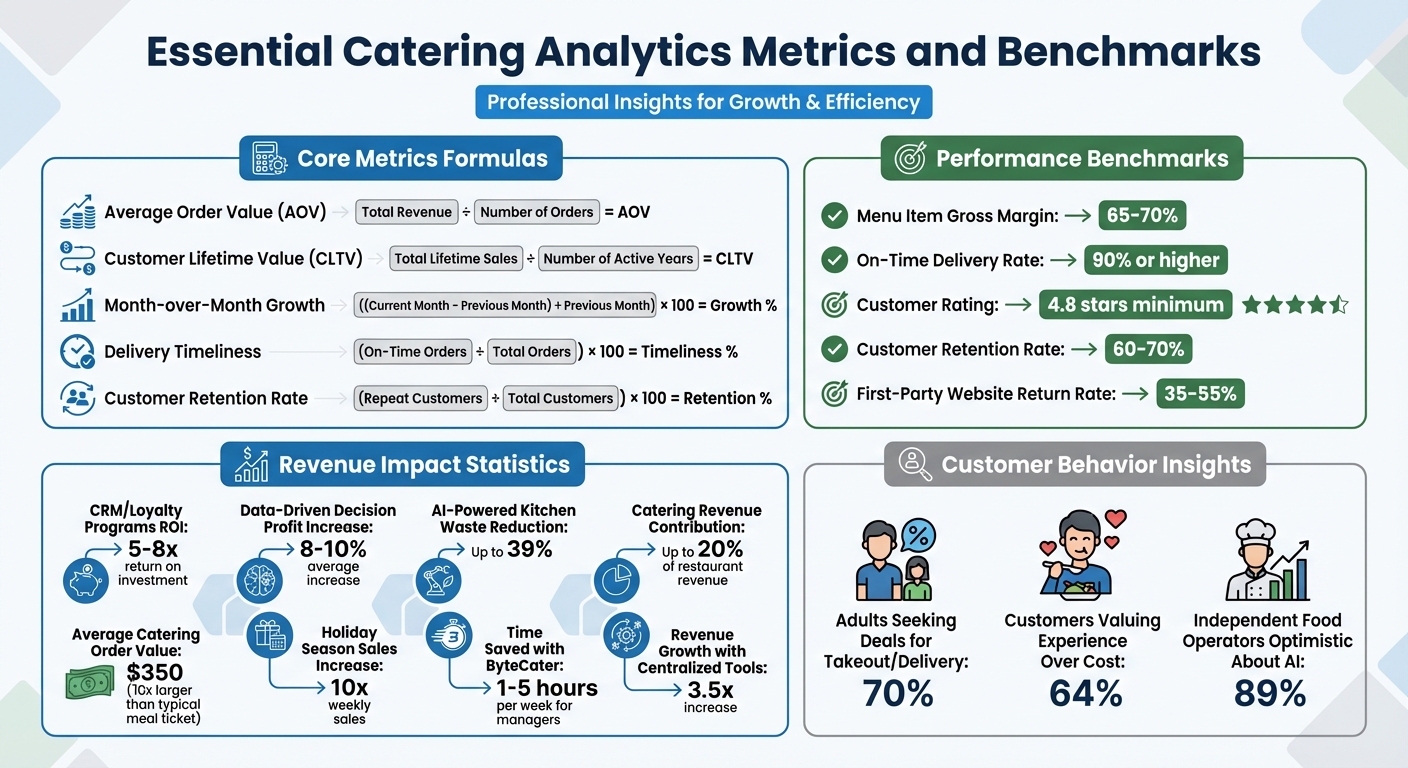
Keeping an eye on the right metrics can turn raw data into actionable insights that drive profits. Below are the essential metrics every catering business should monitor.
Order volume measures how many catering orders you’re handling over a specific period - weekly, monthly, or quarterly. It highlights seasonal trends and helps you fine-tune your marketing efforts and staffing levels.
Order frequency goes deeper, tracking how often customers place repeat orders. This data is crucial for calculating Customer Lifetime Value (CLTV), which you get by dividing total lifetime sales by the number of active years. You can also identify high-frequency customer groups by segmenting clients by industry. Want to track growth? Use this formula for month-over-month growth:
((Current Month - Previous Month) ÷ Previous Month) x 100.
"Trends tell you when to push harder or pump the brakes. See a slump? Maybe it's time to fire up a promo. Hitting record numbers? Double down and ride that wave."
- Michael Attias, Founder, CaterZen
These metrics provide a foundation for understanding what drives your revenue.
Building on order frequency, Average Order Value (AOV) reveals how much revenue you’re generating per event. To calculate it, divide total revenue by the number of orders. Breaking AOV down by event type - like corporate lunches, weddings, or nonprofit events - can show which categories bring in the most revenue per order.
This analysis also highlights which menu items, add-ons, and modifiers are popular, helping you create high-margin bundles. A good benchmark for gross margins on menu items typically falls between 65–70%.
| Metric | Formula | Benchmark |
|---|---|---|
| Average Order Value | Total Revenue ÷ Number of Orders | Track trend over time |
| Menu Item Profitability | (Selling Price − Food Cost) ÷ Selling Price × 100 | 65–70% Gross Margin |
| Customer Retention Rate | (Repeat Customers ÷ Total Customers) × 100 | 60–70% |
"Not all catering jobs are created equal. A corporate lunch might net you $500. A wedding? $5,000. This report helps you fish where the big fish swim."
- Michael Attias, Founder, CaterZen
Once you’ve nailed down order trends, it’s time to ensure your delivery service meets expectations. Start by tracking delivery timeliness using this formula:
(On-Time Orders ÷ Total Orders) × 100. Aim for an on-time delivery rate of 90% or higher. On-time delivery is typically defined as arriving within a 15-minute window - being too early or too late can hurt reliability scores.
As ezCater puts it:
"Our customers plan their events with the expectation that the food will arrive on time, in full, and as expected. When orders are late... it can cost people jobs, clients, their reputation, and money."
- ezCater
You’ll also want to monitor order accuracy, which measures the percentage of problem-free orders. Issues like missing items, forgotten utensils, or dietary request errors can hurt your reputation. Using kitchen print-outs as checklists during driver hand-offs can help ensure 100% accuracy. If your data shows that order volume is stretching kitchen capacity, tools like “busy hours” features can pause new orders to maintain service quality.
Lastly, platforms like ezCater expect catering partners to maintain an average customer rating of at least 4.8 stars.
Centralizing your catering data can uncover trends and drive revenue growth. Here's a closer look at the key data sources that support effective catering analytics.
Your POS system is a goldmine of information, tracking item-level sales, discounts, tips, and order types. Meanwhile, first-party websites and mobile apps offer a direct window into customer behavior, with return rates ranging between 35–55%. On the other hand, third-party aggregators like DoorDash and Uber Eats can bring in more orders but often limit access to customer data, making it harder to build direct relationships.
Catering management software organizes event-specific details, such as lead tracking, creating proposals, and automating invoices. Combine this with CRM and loyalty programs, and you can monitor guest preferences, visit patterns, and spending habits. These tools have been shown to generate a 5–8x return on investment when used for personalized marketing strategies. Additionally, labor and inventory systems, like digital timesheets and recipe-linked inventory tools, help connect order volumes with operational costs and waste management.
To tie all these pieces together, Open APIs are essential. They allow different systems to exchange data, creating a centralized data hub for analysis. When selecting software, prioritize platforms that support open APIs to ensure your tech stack works seamlessly rather than operating in silos.
For a fully integrated solution, tools like Bytes AI's ByteCater can simplify the process by offering a unified dashboard.
Bytes AI's ByteCater consolidates orders from all platforms into one dashboard, automates label creation, and syncs inventory and delivery data to enhance efficiency and boost revenue. This system eliminates the need to manually search for orders, providing an organized "one-stop shop" for production sheets, all-day totals, and meal-specific requirements.
The platform also calculates prep items and automates label creation, reducing the risk of production delays and inventory shortages. By integrating with POS systems, third-party apps, and delivery services, it streamlines driver scheduling and ensures smooth operations. Byte Kitchen puts it best:
"By automatically centralizing all your catering orders into one place, never miss an order again, stay on top of production sheets, and avoid scrambling last minute"
Restaurants that have adopted centralized tools like ByteCater have seen catering revenue grow by 3.5X, while managers save between 1 to 5 hours weekly.
Before implementing any system, it's crucial to standardize your data. Michael Attias from CaterZen emphasizes:
"Clean Up Your Data Pantry – Standardize your item names, customer groups, and delivery zones. Garbage in = garbage out"
Once your data is centralized, the next step is turning it into insights that can shape your business decisions. Descriptive analytics focuses on understanding past performance, like identifying your best-selling items, busiest days, or the results of previous promotions. On the other hand, predictive analytics uses historical data and seasonal trends to forecast future demand, helping you plan inventory and staffing more efficiently.
But it’s not just about numbers - it’s about understanding the why behind them. As the DoorDash Merchant Blog explains:
"Analytics compares larger data sets to draw conclusions that are more nuanced and addressable. In other words, while reporting shows you the what, analytics tells you the why."
Businesses that rely on data-driven decisions often see profits increase by 8% to 10% on average. For catering businesses, this might mean uncovering which event types bring in the most revenue, which menu items are your top earners, and where you could be missing opportunities. Analytics like these help you spot trends and build strategies tailored to your goals.
Tracking trends involves comparing historical data over time - monthly, quarterly, or annually. For instance, if corporate lunch orders typically slow down in July but drop more sharply than usual compared to last year, it might indicate a problem that needs attention.
Trend analysis also helps you decide whether to scale up efforts, like increasing advertising or hiring more staff, based on growth metrics. Menu engineering takes it further by analyzing individual item performance, identifying high-margin, high-volume "cash cow" items, and flagging underperformers.
You can also break down revenue by event type - such as corporate lunches versus weddings - to see which categories generate the most income per event. Meanwhile, analyzing basket behavior can reveal popular combinations, helping you create optimized bundles and upselling opportunities. For example, if a specific wrap is frequently ordered with certain sides, promoting that combination could boost sales.
Once you’ve spotted trends, you can segment your clients to deliver more tailored services. Use niche-based tagging in your CRM to group clients by industry, such as law firms, schools, or churches, enabling targeted reactivation campaigns. Similarly, segmenting clients by event type allows you to identify high-value customers and customize proposals for their specific needs.
Behavioral segmentation focuses on ordering habits, like frequency or timing, so you can automate reminders for rebookings. For example, if a client regularly orders quarterly team lunches, your system could send a reminder a couple of weeks before their typical reorder date. Value-based segmentation calculates Customer Lifetime Value (CLTV), helping you prioritize long-term, high-value accounts.
Additionally, with 7 out of 10 adults looking for deals when ordering takeout or delivery, you can segment customers by loyalty status - new versus returning - and offer personalized rewards or incentives to reduce churn.
After identifying trends and segmenting clients, performance dashboards bring everything together, offering a clear and actionable view of your business. By integrating data from your POS, inventory management, and scheduling tools, dashboards give you near real-time insights. This allows you to make adjustments during service - like reprioritizing prep or pausing promotions - rather than catching issues too late.
Dashboards also help highlight operational inefficiencies, such as stock discrepancies, unnecessary purchases, or labor productivity gaps, that might be overlooked in raw spreadsheets. They can be tailored to specific roles: kitchen managers can focus on prep metrics, while owners monitor profitability and growth. As Geert Merckaert from Apicbase puts it:
"The trick to winning in the F&B industry is working smarter… not harder."
Tools like Bytes AI’s ByteCater integrate with dashboards to provide a consolidated view of key metrics, including sales, costs, and ROI. Just keep in mind that consistent data entry - standardizing item names, order types, and discount labels - is essential for accurate and reliable insights.
To turn insights into actionable results, start by establishing clear goals that directly influence revenue and costs. These might include adjusting menu prices, refining inventory schedules, or optimizing staff shifts. Without defined objectives, data remains just numbers on a screen.
Next, create a comprehensive map of your data sources. This includes POS systems, ordering platforms, delivery apps, CRMs, and reservation tools. As Sakthi Vignesh from Restolabs puts it:
"Analysis only creates value when it leads to measurable changes in how your restaurant runs."
Once you've mapped your systems, focus on standardizing your data. Inconsistent naming conventions - for example, labeling an item as "Veg Burger" in one system and "VB" in another - can lead to fragmented and inaccurate sales reports. Clean, consistent data is essential. As Michael Attias, Founder of CaterZen, advises:
"Garbage in = garbage out. Standardize your item names, customer groups, and delivery zones."
With clear objectives and a unified data inventory, you can integrate your systems to enable real-time decision-making.
The real power of analytics lies in connecting your systems. Direct POS integration eliminates the inefficiencies of manual data exports, providing a unified view of orders, customer behavior, and fulfillment. Modern catering operations benefit from using API-enabled tools that allow seamless communication between POS systems, driver apps, and accounting software.
For example, Sweetgreen uses centralized analytics powered by standardized tagging and real-time data integration to improve customer retention and operational flexibility. This setup even allows for on-the-fly decisions, like pausing new orders when the kitchen reaches capacity.
Bytes AI's ByteCater takes integration a step further by syncing all your systems into a single dashboard. It tracks everything from sales and ROI to order details, thanks to AI-powered phone assistants that reduce manual errors. Real-time updates ensure that menu data, pricing, and availability are always accurate across channels, aligning customer-facing options with internal analytics.
Integrated data can help you fine-tune your menu and streamline inventory management. Menu engineering should be a dynamic process, categorizing items by profitability and popularity in real time instead of relying on outdated annual reviews. Aiming for gross margins of 65% to 70% is a good benchmark, but remember, not all top-sellers are highly profitable. Dishes with costly ingredients may have slimmer margins.
Analyzing basket behavior - the combinations of items, add-ons, and modifiers customers frequently order - can help you create high-margin bundles and boost upselling opportunities. On the inventory side, demand forecasting uses past sales and seasonal trends to predict future needs, reducing waste and avoiding stock-outs. AI-powered kitchens are already cutting food waste by up to 39%. Additionally, tracking inventory variance - the difference between theoretical and actual stock levels - can highlight issues like overplating, waste, or theft. Regularly reviewing item margins can also alert you to vendor price changes, while monitoring for negative inventory levels can flag unexpected purchases outside negotiated pricing.
Beyond improving menus and inventory, analytics can also transform how you engage with customers, driving loyalty and retention.
Using analytics for marketing allows you to create targeted, personalized campaigns that resonate with your customers. Start by segmenting clients based on their ordering habits, such as frequency, event type, or spending patterns. This enables you to send tailored offers that align with their preferences. With 70% of adults actively seeking deals for takeout or delivery, personalized promotions can significantly reduce churn. Automation tools, like smart rebooking reminders for corporate clients, can further streamline follow-ups and keep your restaurant top of mind.
Bytes AI simplifies this process with tools that track coupon usage, loyalty redemptions, and promotional campaign performance. Additionally, monitoring customer reviews across platforms can help you identify and address recurring service issues before they impact loyalty. Considering that 64% of customers value their dining experience more than meal cost, resolving service bottlenecks - like order errors or delays - can directly enhance retention.
Finally, train your team to interpret analytics dashboards and apply insights to daily operations. For instance, managers can adjust prep schedules or discontinue underperforming promotions based on data trends. With 89% of independent food operators optimistic about AI's role in their business, embracing data-driven strategies is no longer optional - it's becoming the norm for catering success.
Catering order analytics takes the guesswork out of decision-making by turning raw data into actionable insights. With improved forecasting, you can analyze past sales trends to predict future demand, ensuring your inventory and staffing levels are spot on. This approach reduces food waste and aligns labor costs with actual demand. Plus, AI-powered kitchens are proving to be game-changers in cutting down waste.
Metrics like sales per labor hour help avoid overstaffing during slow times and understaffing when catering orders surge. Menu engineering and data-backed strategies can also lead to higher profitability. By integrating catering data with POS systems, restaurants can eliminate the hassle of manual order entry, saving valuable time for staff and accounting teams. As Brian Pearson, CTO of Mendocino Farms, puts it:
"We're giving back hours a day to our catering specialists, store operators, accounting team, and technology team"
.
The financial upside is undeniable. Catering can account for up to 20% of a restaurant's revenue, with weekly sales skyrocketing by 10x during holiday catering seasons. The average catering order, valued at $350, is roughly 10x larger than a typical meal ticket. Every optimization you make has the potential to drive meaningful results.
To tap into these benefits, start by integrating your data systems. Combine your POS, inventory, and scheduling platforms into a single dashboard to gain real-time insights. Tools like Bytes AI's ByteCater make this easier by syncing systems and offering AI-powered phone assistants that cut down on manual data entry while tracking sales, ROI, and order details in real time.
Set clear KPIs such as Revenue Per Seat Hour, Cost of Goods Sold, and repeat customer rates to measure your progress. Train your team to leverage dashboards for smarter daily decisions, whether it’s adjusting prep schedules or phasing out ineffective promotions. As Michael Attias, Founder of CaterZen, explains:
"Instinct is still valuable, but in 2025, data drives the decisions"
. With 89% of independent food operators expressing optimism about AI's role in their business, now is the time to embrace these strategies and turn your catering operations into a powerhouse of efficiency and profitability.
Start by monitoring total sales, sales trends over time, and profitability per event. These key metrics reveal revenue patterns, helping you make smarter decisions about pricing, staffing, and marketing efforts. By focusing on these essentials, you'll gain practical insights to fine-tune your catering operations.
To bring together POS, CRM, and delivery data, a centralized order aggregation system is key. This type of system pulls all operational data into a single dashboard, offering real-time updates and smoother workflows. By using tools like APIs, webhooks, or middleware, you can ensure data flows accurately between platforms. This not only simplifies reporting and inventory tracking but also helps boost overall efficiency.
Analytics takes both historical and real-time data to forecast customer preferences and ordering trends. This means you can fine-tune your inventory management by stocking the right ingredients in just the right quantities. The result? Less overordering, minimized food waste, and a more efficient kitchen.